
A lower purchase price does not always mean a lower overall cost. Cost benefit analysis templates help you compare options over a stated period, including implementation, recurring costs and the benefits you expect. The useful part is making the assumptions visible enough to question.
The downloadable Excel examples below offer different levels of detail. Compare the previews and inspect the formulas in the actual file before using live figures. A simple option comparison and a longer appraisal may need different timing, units and treatment of uncertainty.
This guide uses a small operational change to explain how to build a readable comparison. It focuses on consistent scope, evidence and sensitivity checks. An attractive positive total should not hide missing costs or benefits that cannot yet be supported.
Define the decision and the comparison period
State which decision the analysis supports and identify the options being compared. Include the current approach where it is a meaningful alternative. Use the same scope and period for each option so that differences are interpretable.
A one-year subscription should not be compared with a multi-year purchase total without explaining the timing. Identify the currency and whether amounts are actuals, quotes or estimates. Keep the question narrow enough that the workbook can answer it.
If an option also changes the level of service, record that difference rather than treating two unequal outputs as if price alone decides the comparison.
Build a cost list from the actual work
Consider what would be needed to implement and operate each option. Alongside the initial price, that may include setup, training, transition work, support and recurring charges. Use the relevant information available for the decision rather than assuming every possible category applies.
Distinguish cash expenditure from staff time and other resources so that they are not accidentally counted twice. Record the source and date of important figures. If a cost is unknown, identify the gap and the person who can clarify it.
Do not replace a missing estimate with zero merely because the spreadsheet requires a number to produce an attractive summary.
A three-year comparison with an uncertain benefit
Suppose a fictional process change has an initial cost of 1,200 currency units and a recurring cost of 300 per year. The estimated annual benefit is 900.
In a simple three-year illustration without discounting, costs total 2,100 and estimated benefits total 2,700, leaving a difference of 600. If the annual benefit is only 600, estimated benefits become 1,800 and the difference is negative 300.
The point is the dependence on the benefit assumption, not a recommendation to buy anything. A real comparison would establish the relevant period, timing, valuation approach and other costs or effects before using the result.
The example gives the reviewer a specific question to investigate: how well supported is the expected annual benefit?
Explain how each benefit would arise
A benefit should connect a proposed change with an observable result. If you expect reduced rework, describe which work changes and how the reduction will be measured.
Distinguish a cash saving from time released for other tasks; saved minutes do not automatically become money available to spend. Where a benefit cannot reasonably be valued, describe it separately rather than assigning an invented amount.
Check whether two benefits overlap, such as counting the same reduction in effort as both a staffing saving and a productivity gain.
The reader should be able to follow the path from an assumption to the figure without relying on a broad claim that the new option is more efficient.
Keep timing and calculation conventions consistent
Separate one-time and recurring items and place them in the periods when they are expected to occur. Use consistent signs and labels throughout the model.
If the analysis uses discounting or another appraisal convention, identify the method and the appropriate assumptions rather than retaining an unexplained rate from a downloaded sample. A simple undiscounted illustration can help explain basic arithmetic, but it should be labeled as such.
Check formula ranges after adding rows or changing the period. Keep calculations editable and traceable, with inputs distinguished from results so a colleague can understand what changing a figure will affect.
Test the assumptions that could change the choice
Identify the few uncertain inputs that matter most: demand, implementation time, recurring cost or the size of the expected improvement. Try reasonable alternatives and observe whether the comparison changes.
Keep the basis for those alternatives visible instead of choosing extreme values only to make a preferred option win. A sensitivity check is useful because it shows what needs better evidence before a commitment.
If a small change reverses the result, explain that dependence in the decision summary. Avoid presenting a single precise total as if it removed uncertainty about inputs that are still estimates.
Write a decision summary that shows its limits
Present the options, main differences, relevant non-monetized factors and the assumptions that influence the result. State what remains to be confirmed and what would make the analysis worth revisiting. Do not make the summary a copy of every worksheet row.
A decision-maker should be able to see why the comparison favors an option under the stated assumptions and what could change that conclusion. Keep the supporting detail available for review.
The workbook supports a judgment about a defined question; it does not make an uncertain forecast certain or establish that every implementation issue has been resolved.
28 downloadable templates and previews
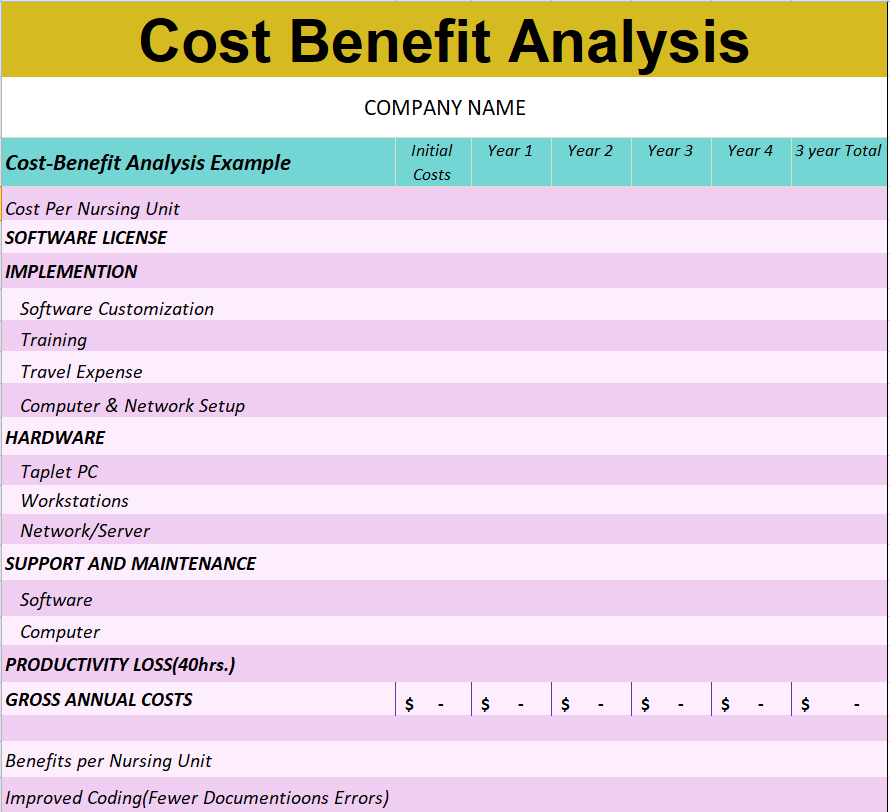
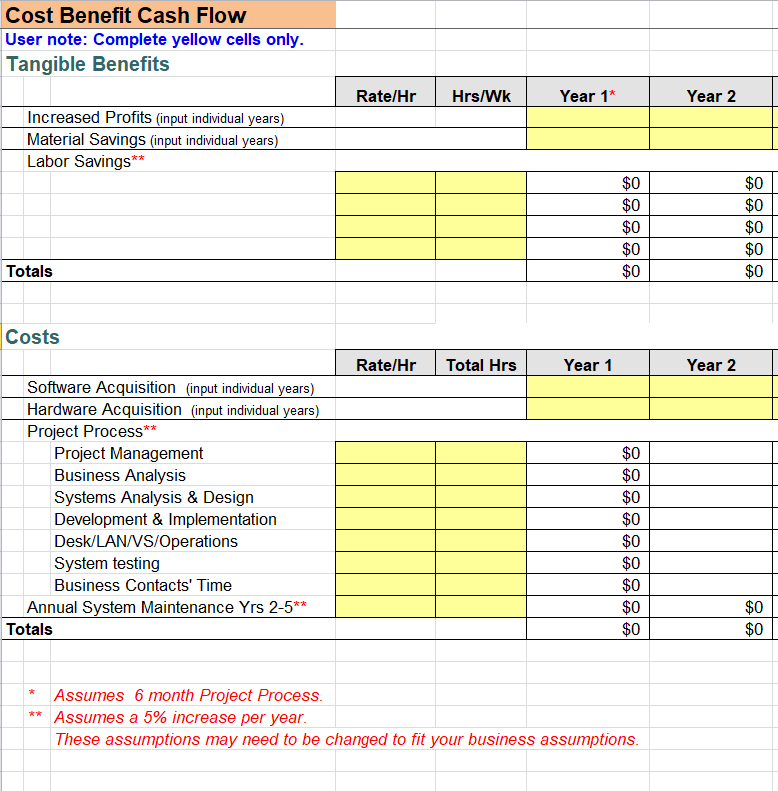
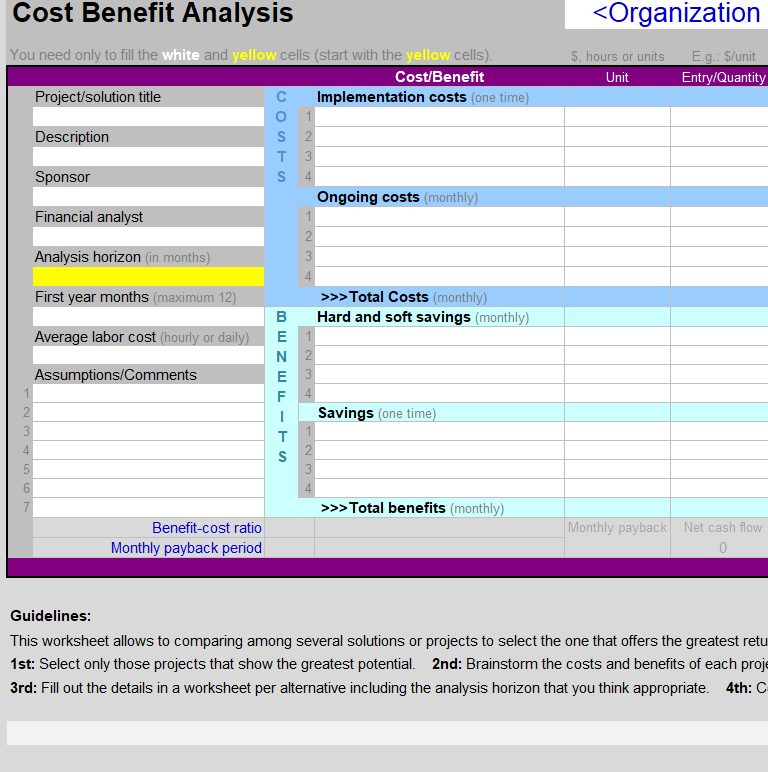
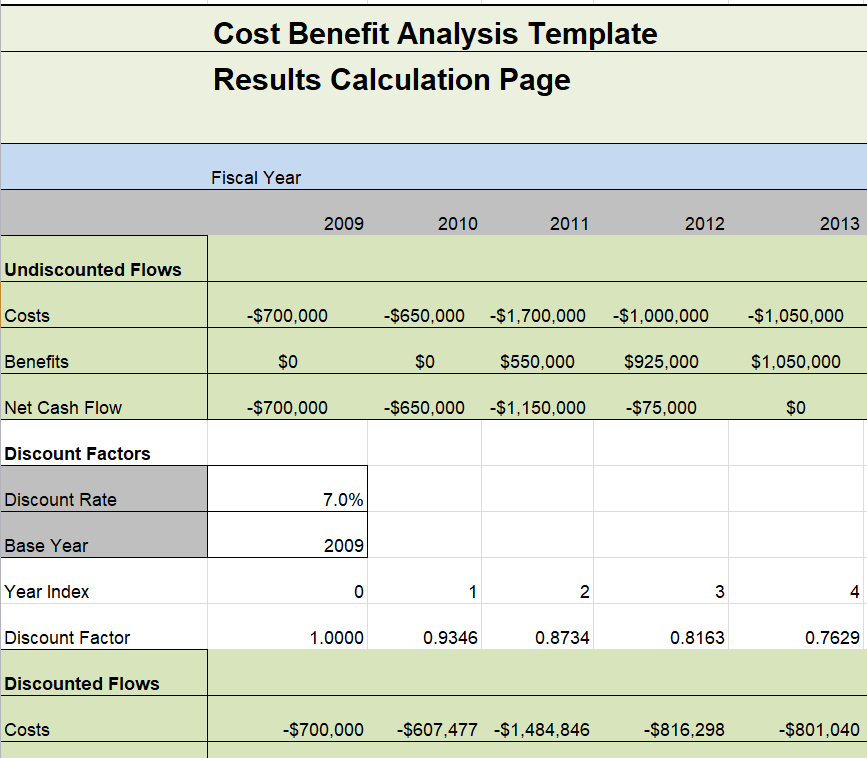
Compare the previews for layout and available fields, then use the download button for the actual file. Check the package contents before editing, because the collection includes different layouts and file types.
Extract ZIP packages first, keep a blank original and save your working copy with a clear name. A preview image is a reference for the layout rather than the editable document.
Company's Cost Benefit Analysis Template
File Size: 09 KB
Basic Cost Benefit Cash Flow Template
File Size: 30 KB
Organization's Cost Benefit Analysis Excel Template
File Size: 19 KB
Blank Cost Benefit Analysis Template
File Size: 10 KB
Elemental Cost Benefit Analysis Template in Excel
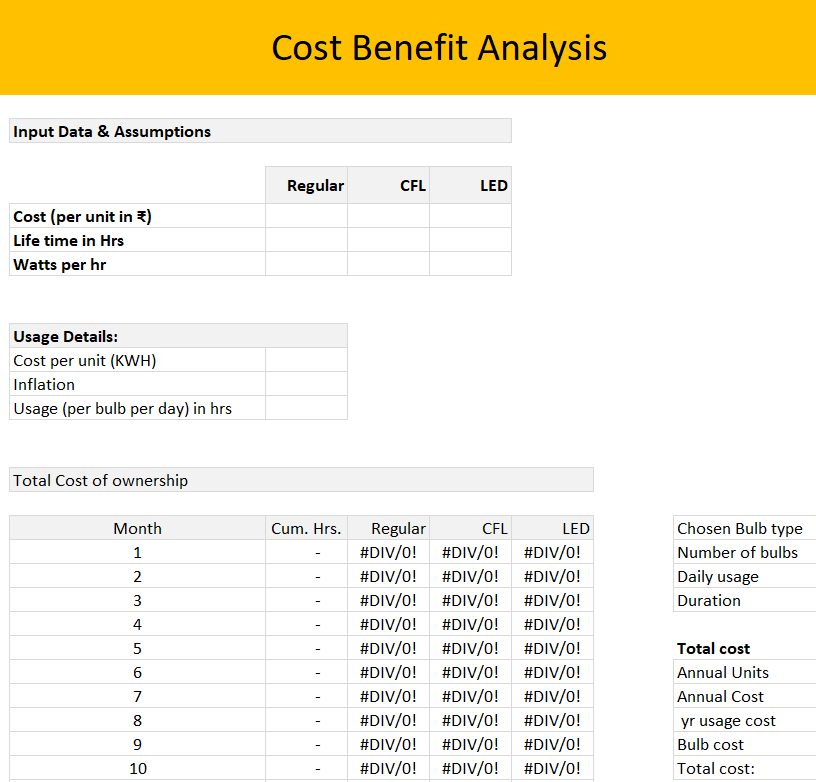
File Size: 21 KB
Handy Cost Benefit Analysis Template
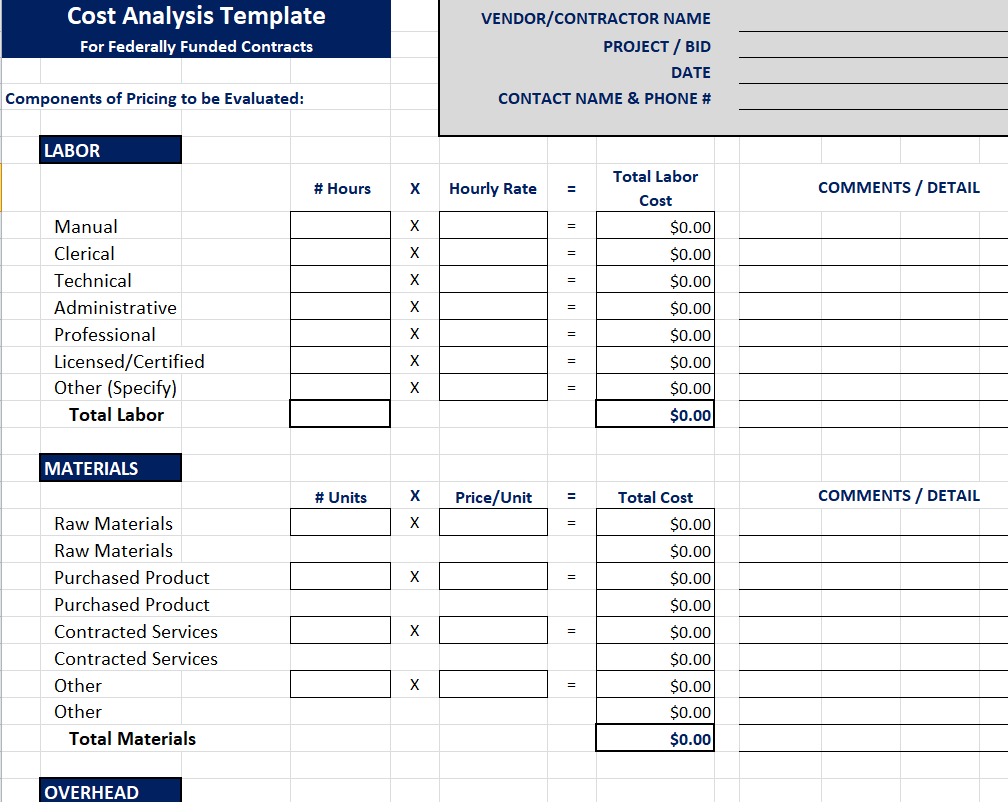
File Size: 10 KB
Simple Cost Benefit Analysis Template in XLSX Format
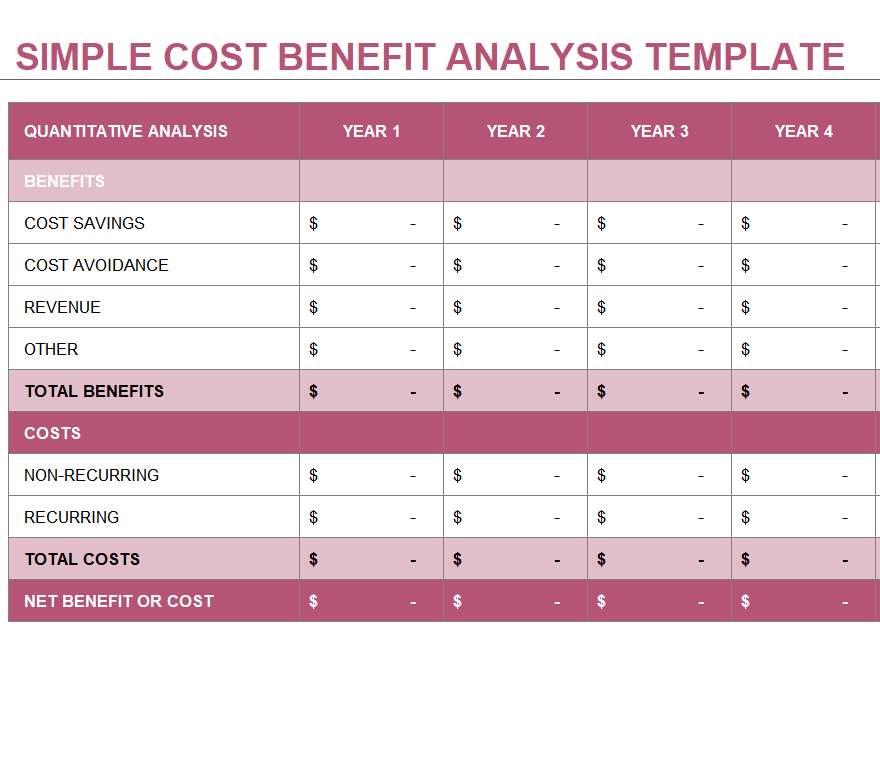
File Size: 15 KB
Fillable Cost Benefit Analysis Template
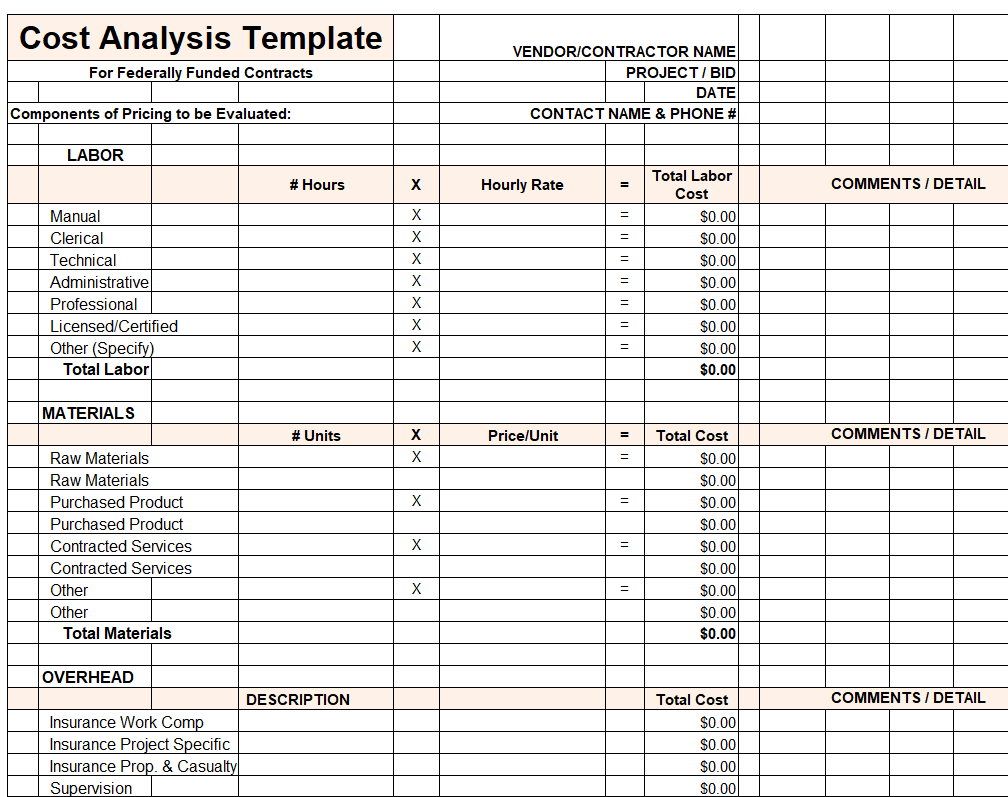
File Size: 13 KB
IT Project Cost Benefit Analysis Template
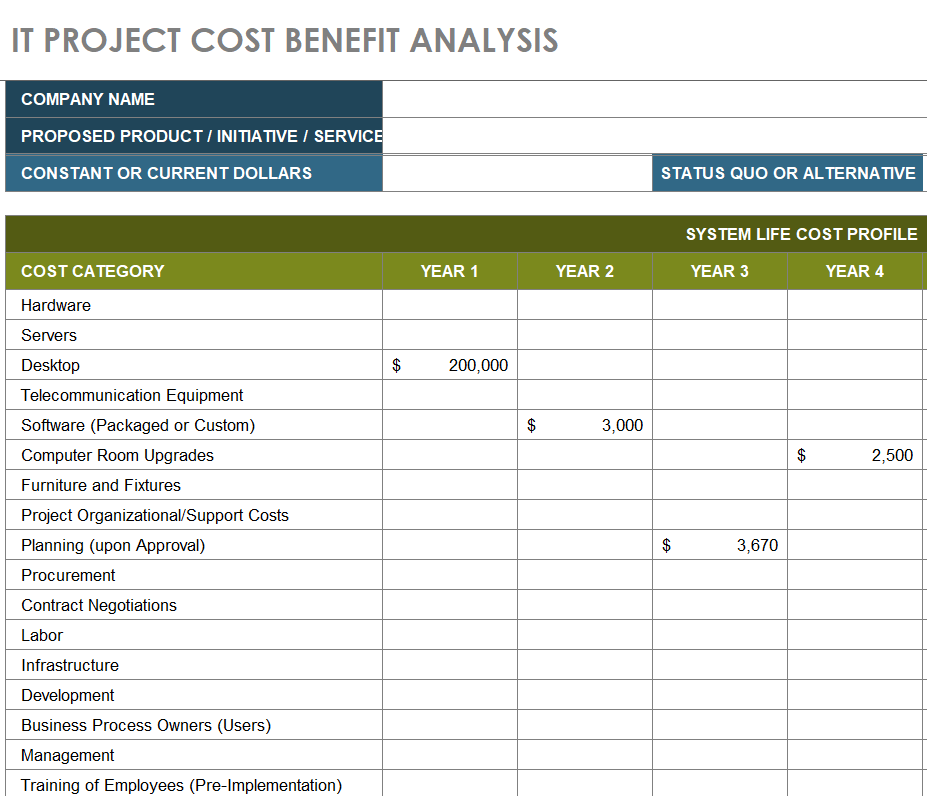
File Size: 71 KB
Simple Cost Benefit Analysis Excel Template
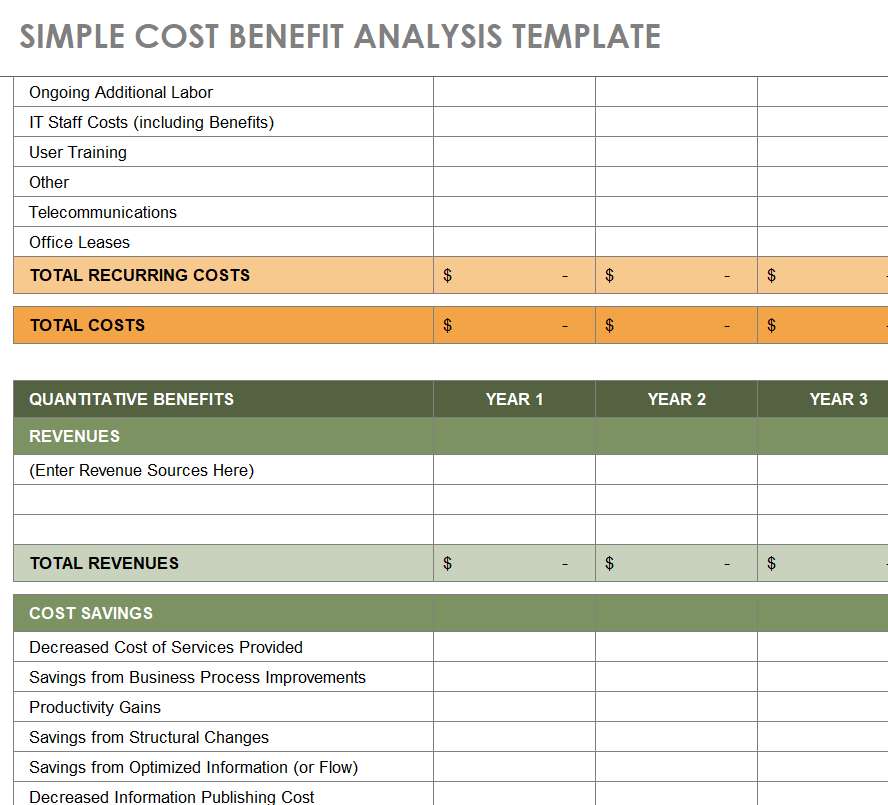
File Size: 64 KB
Investment Project Cost Benefit Analysis Template
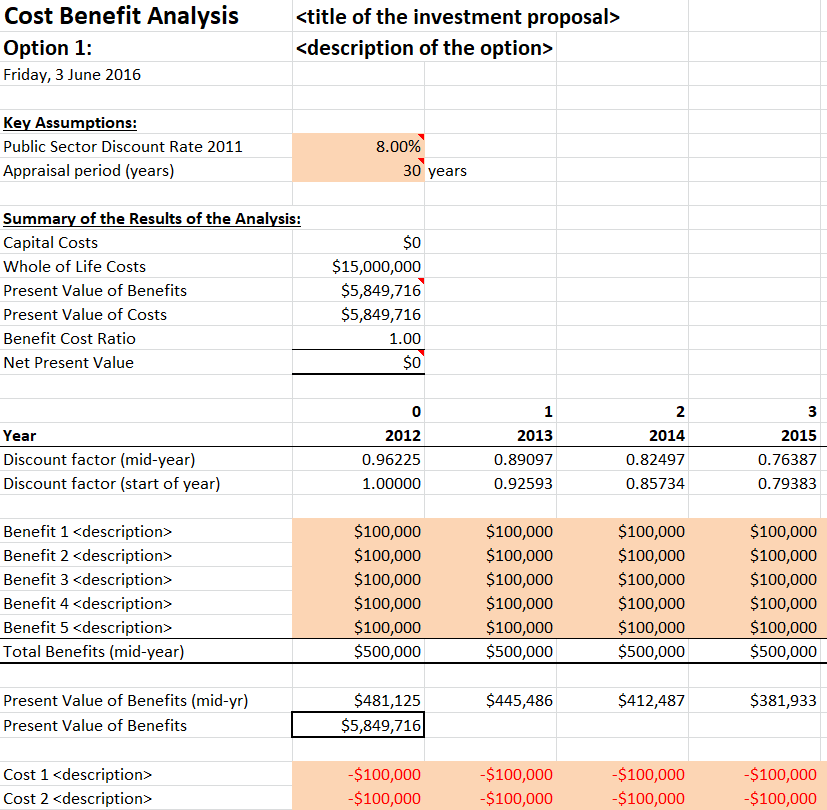
File Size: 87 KB
Customizable Cost Benefit Analysis Template
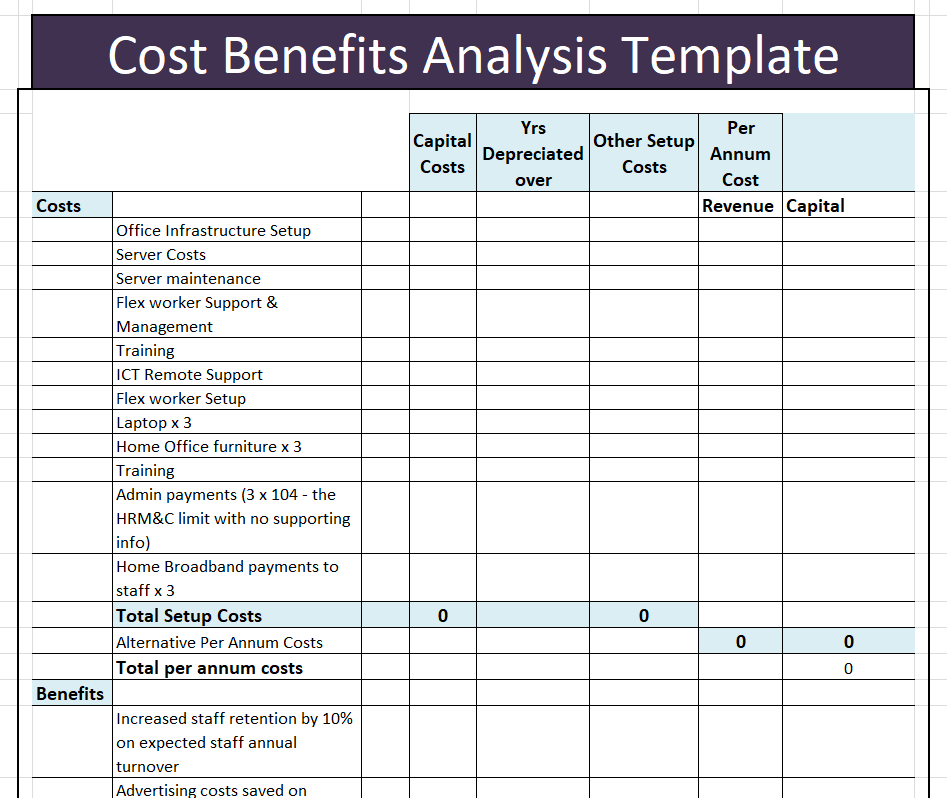
File Size: 09 KB
Product's Cost Benefit Analysis Template
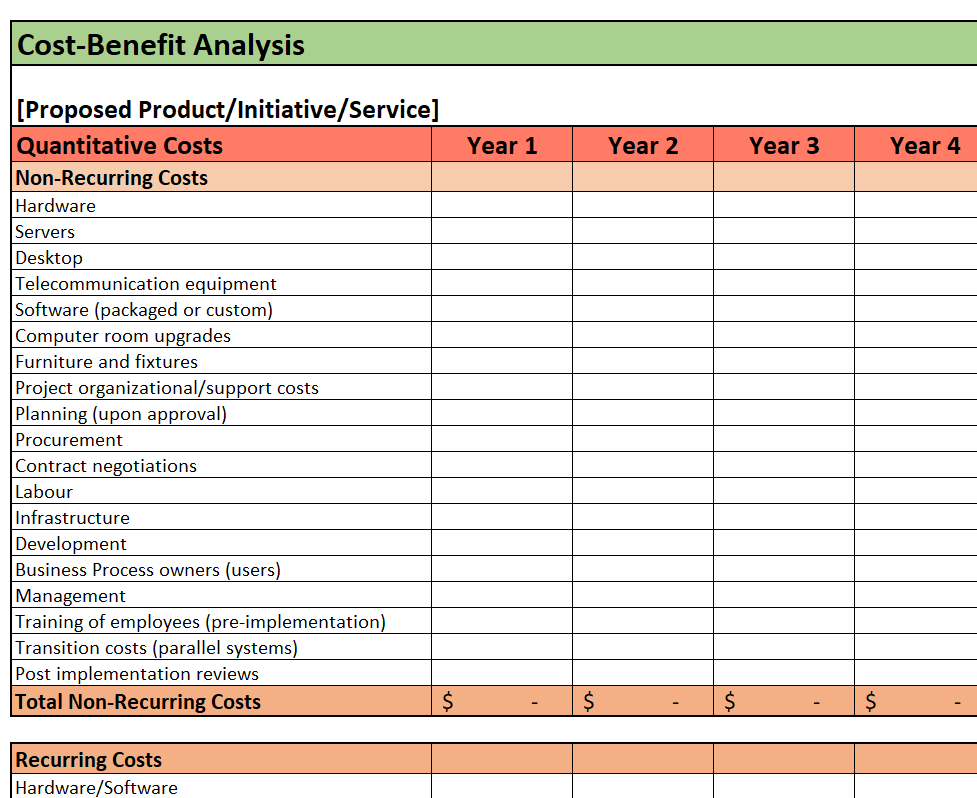
File Size: 13 KB
Cost Benefit Analysis Excel Worksheet Sample
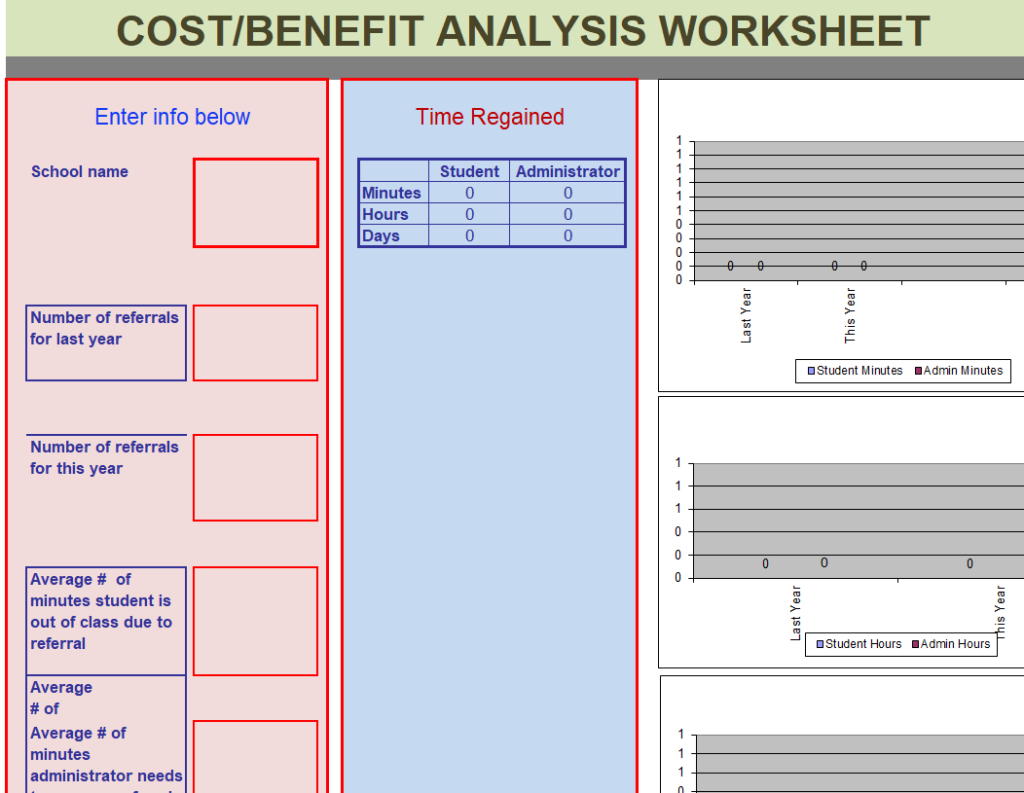
File Size: 17 KB
Project's Cost Benefit Analysis Template
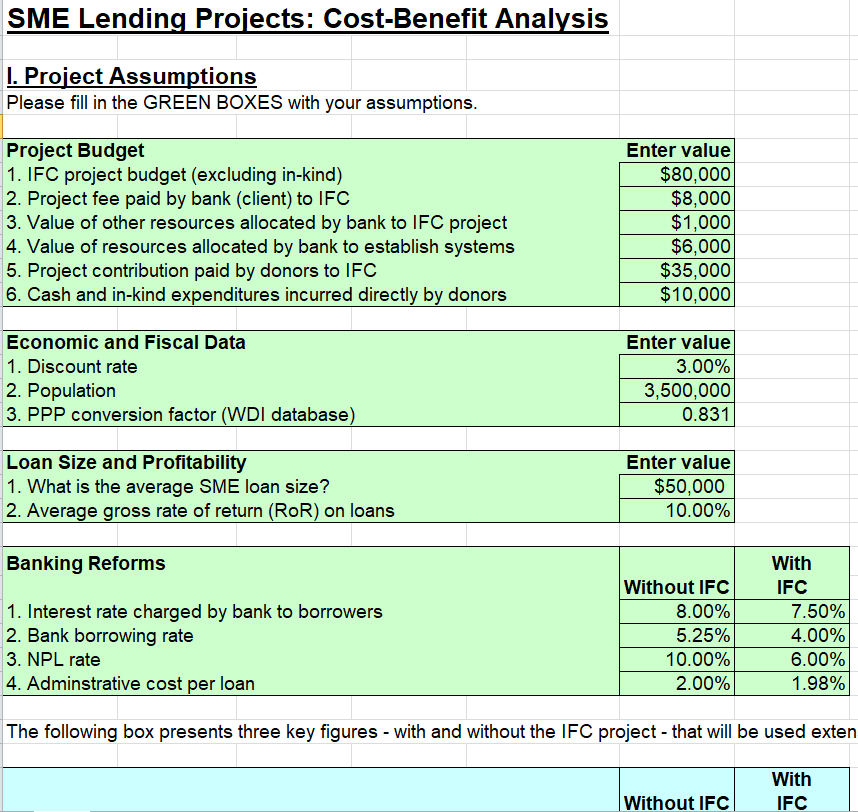
File Size: 19 KB
Cost Benefit Analysis Template for IT Project
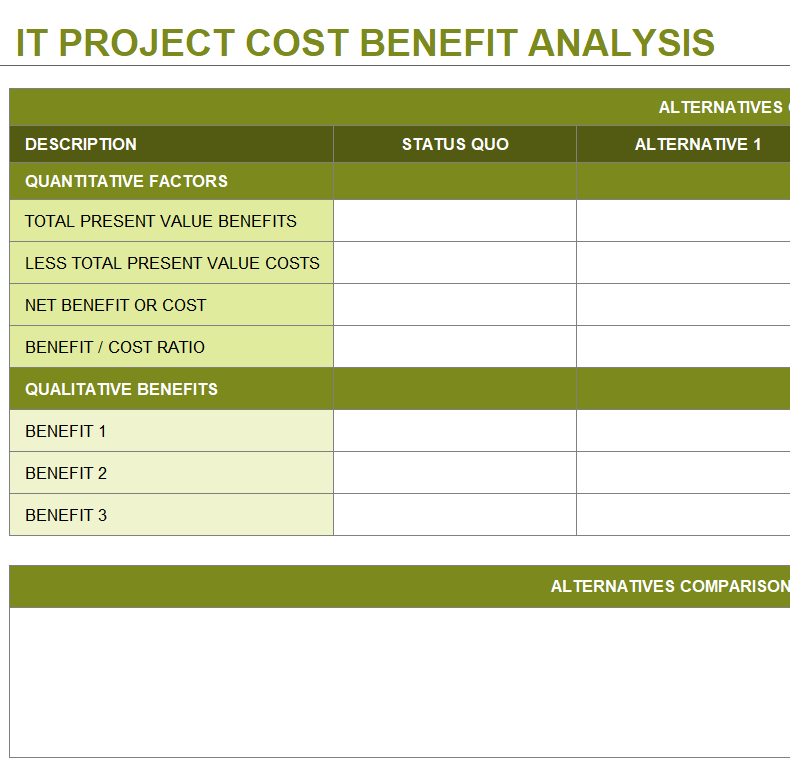
File Size: 51 KB
Simple Cost Benefit Analysis Template
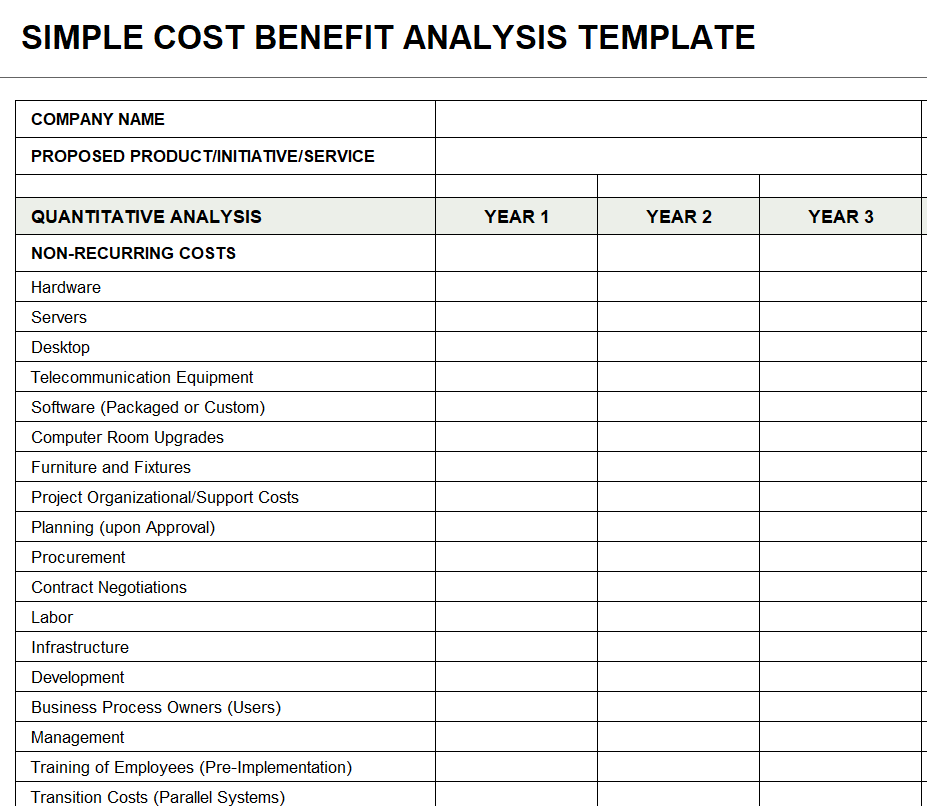
File Size: 17 KB
Cost Benefit Analysis Dashboard Template
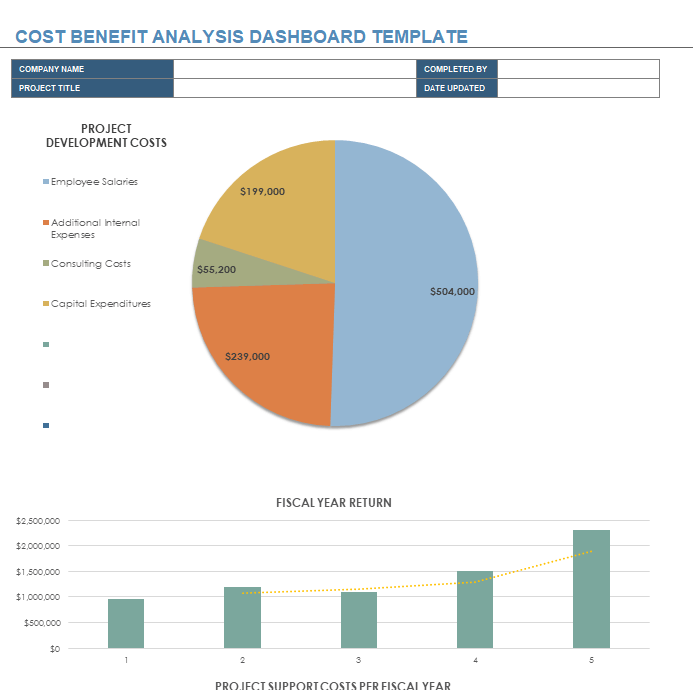
File Size: 383 KB
Cost Benefit Analysis Template
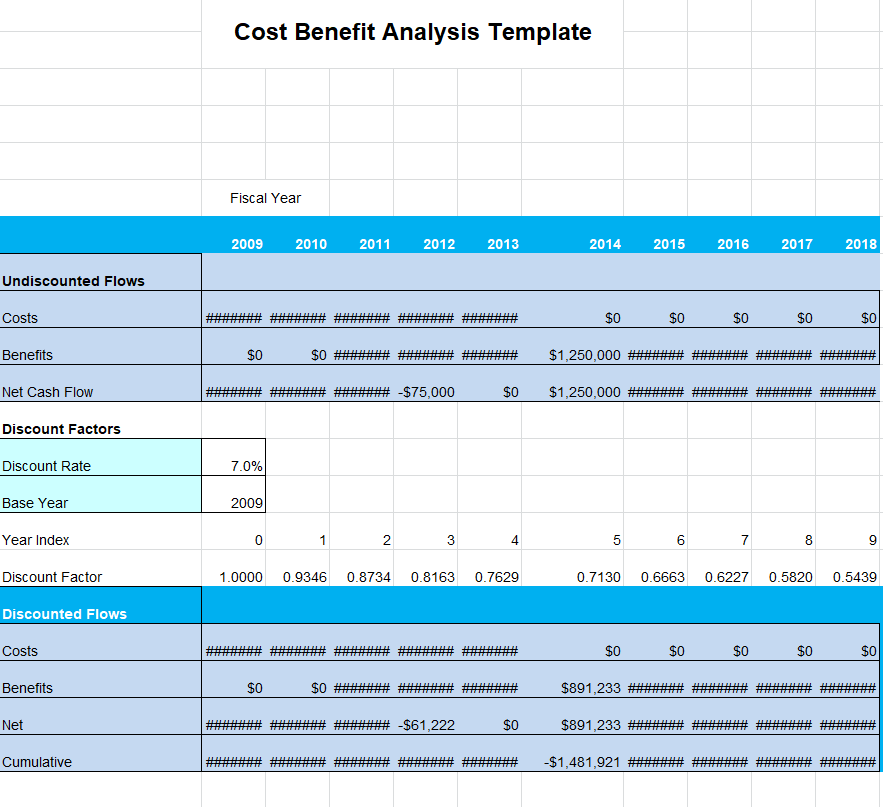
File Size: 10 KB
Business Cost Benefit Analysis Template
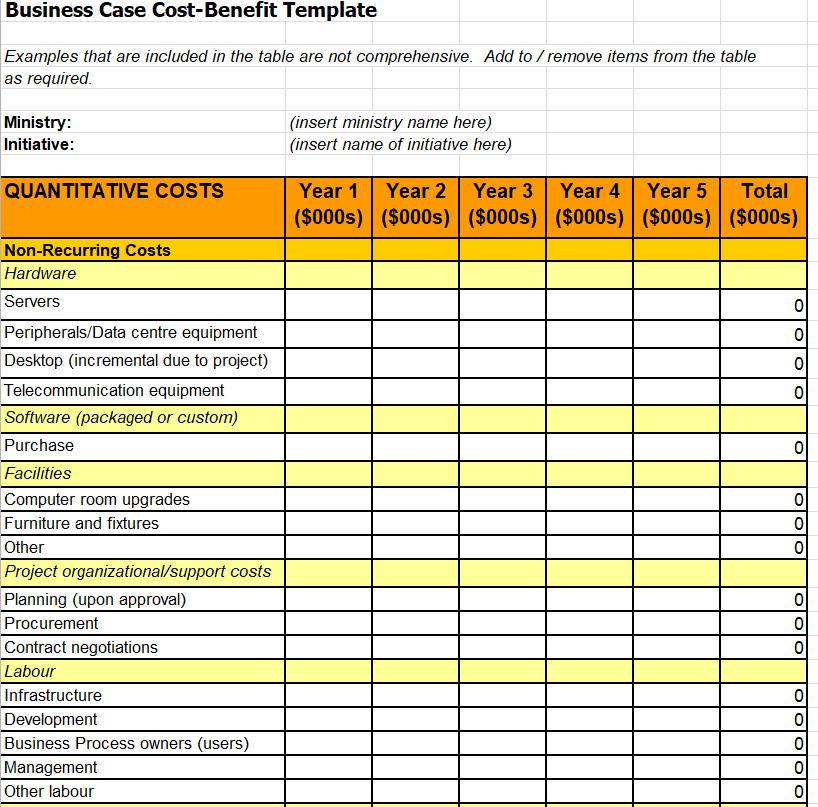
File Size: 14 KB
Sample Cost Benefit Analysis Excel Template
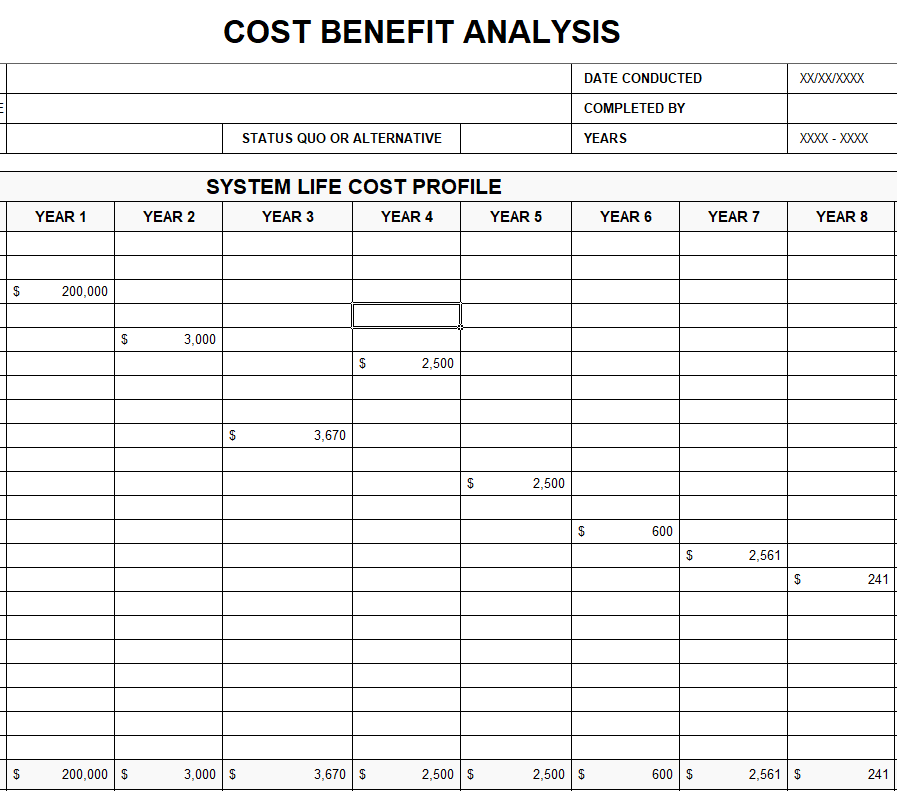
File Size: 23 KB
Useful Cost Benefit Analysis Template in Excel
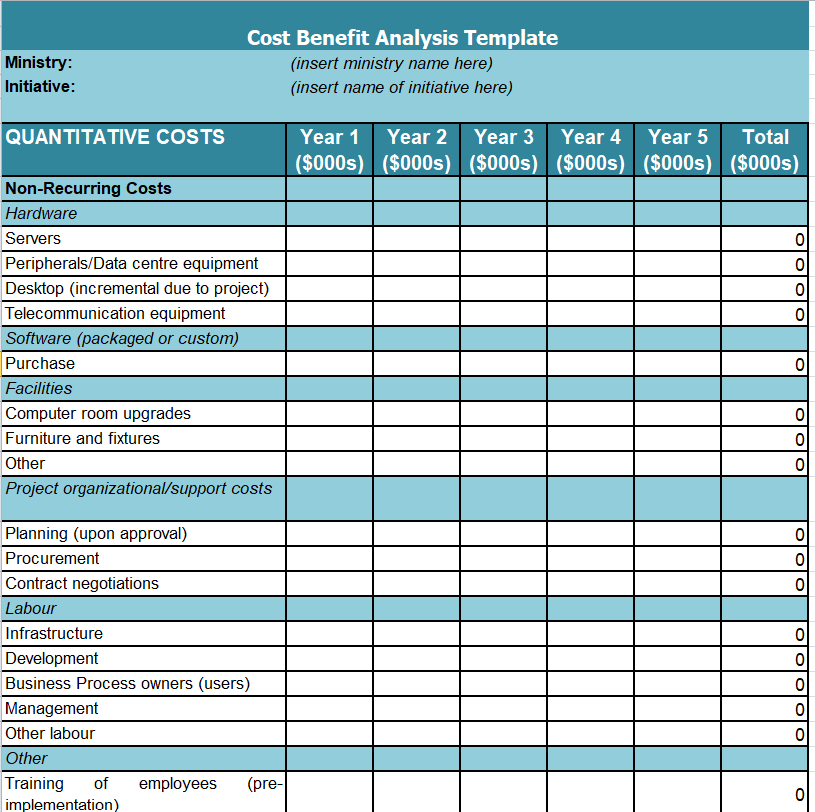
File Size: 12 KB
Project Manager's Cost Benefit Analysis Sheet
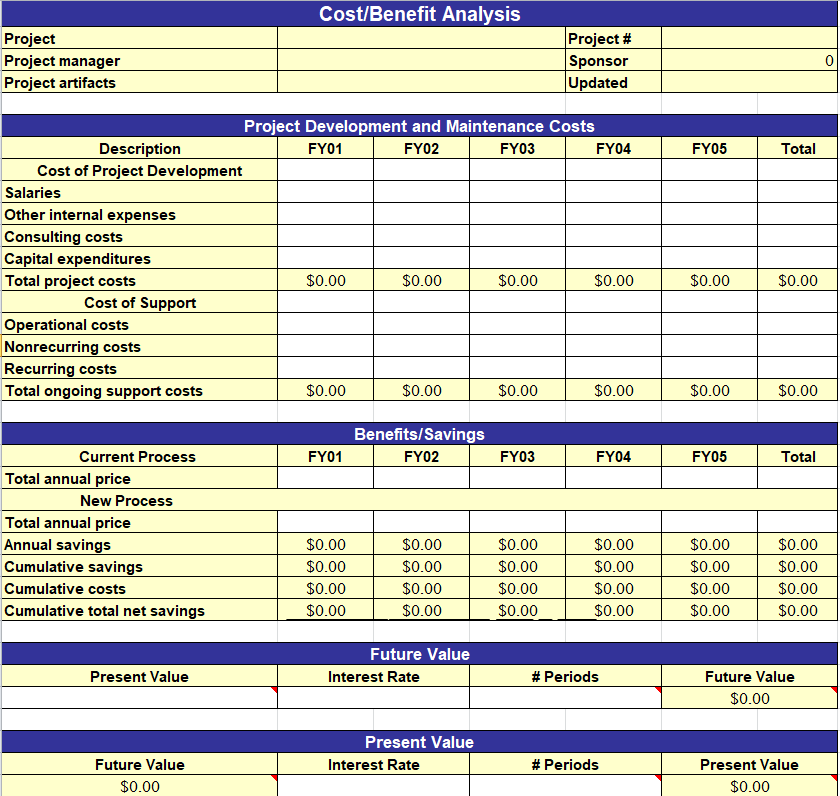
File Size: 273 KB
Cost Benefit Analysis Calculator Template
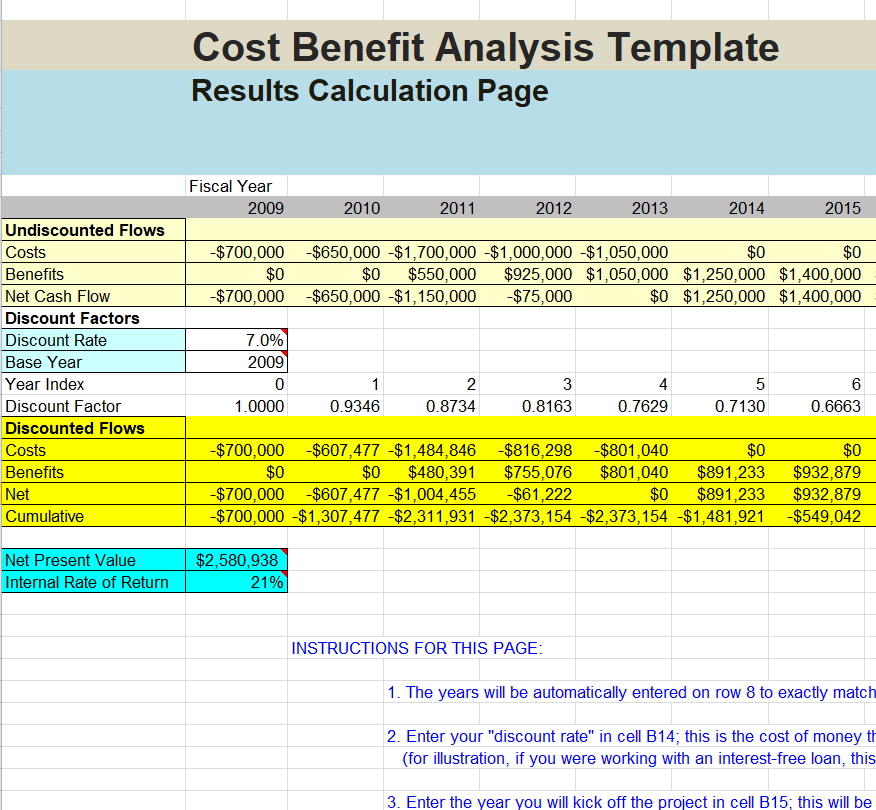
File Size: 66 KB
Cost Benefit Analysis Template for Installation of a Solar PV
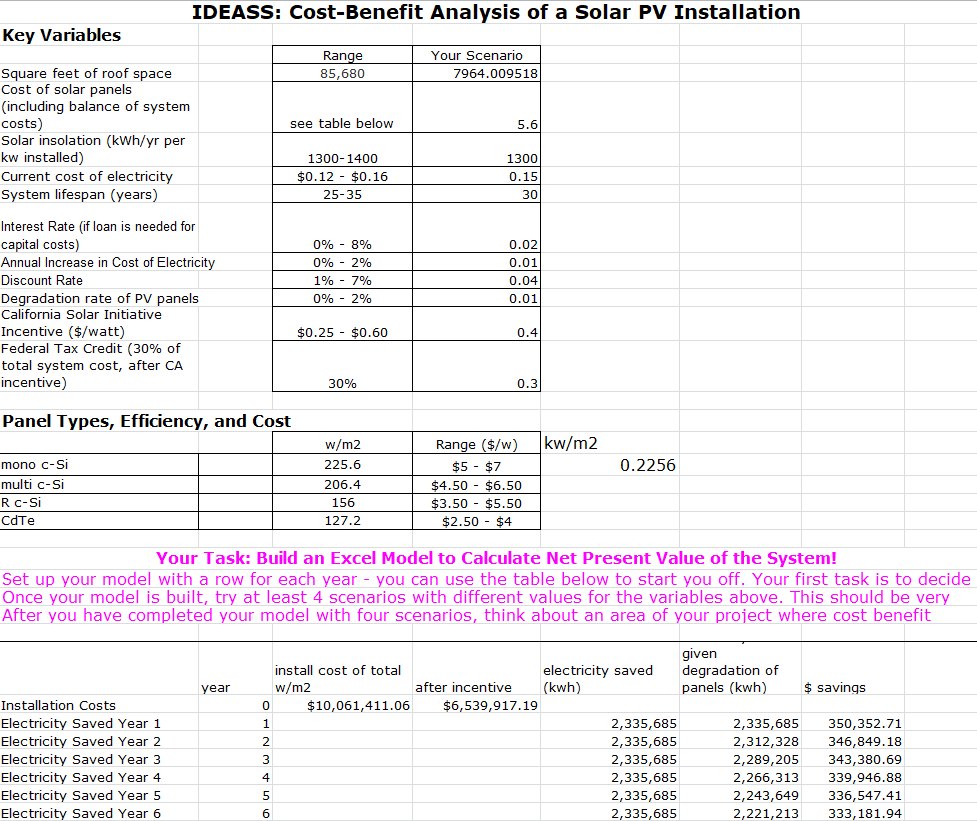
File Size: 12 KB
Cost Benefit Analysis Dashboard Template
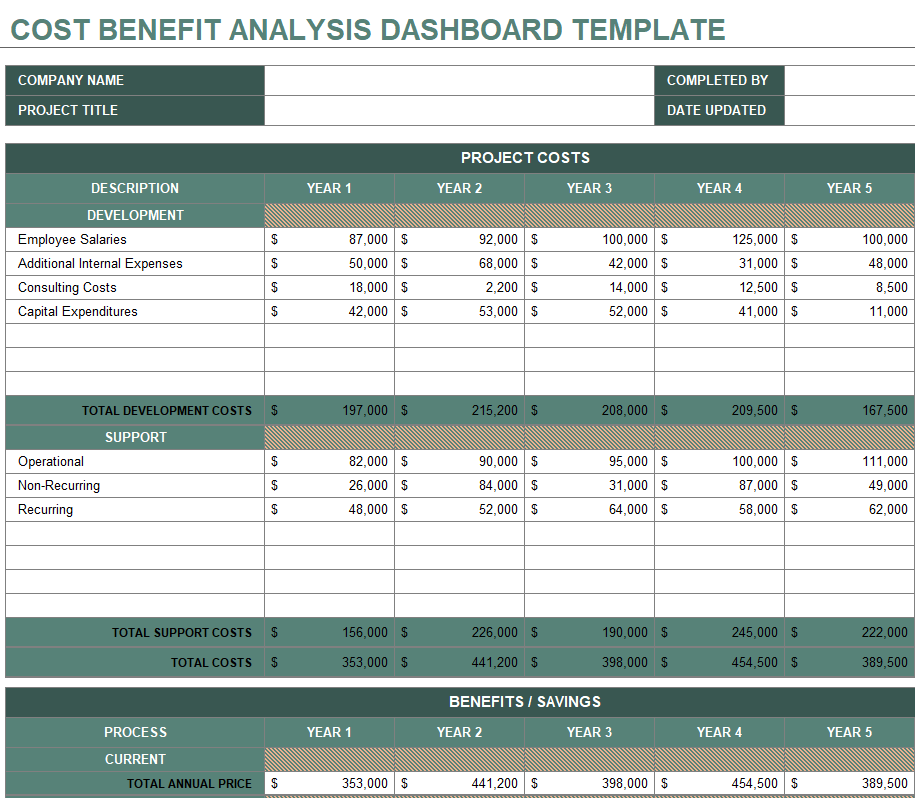
File Size: 26 KB
Business Operations Cost Benefit Analysis Template
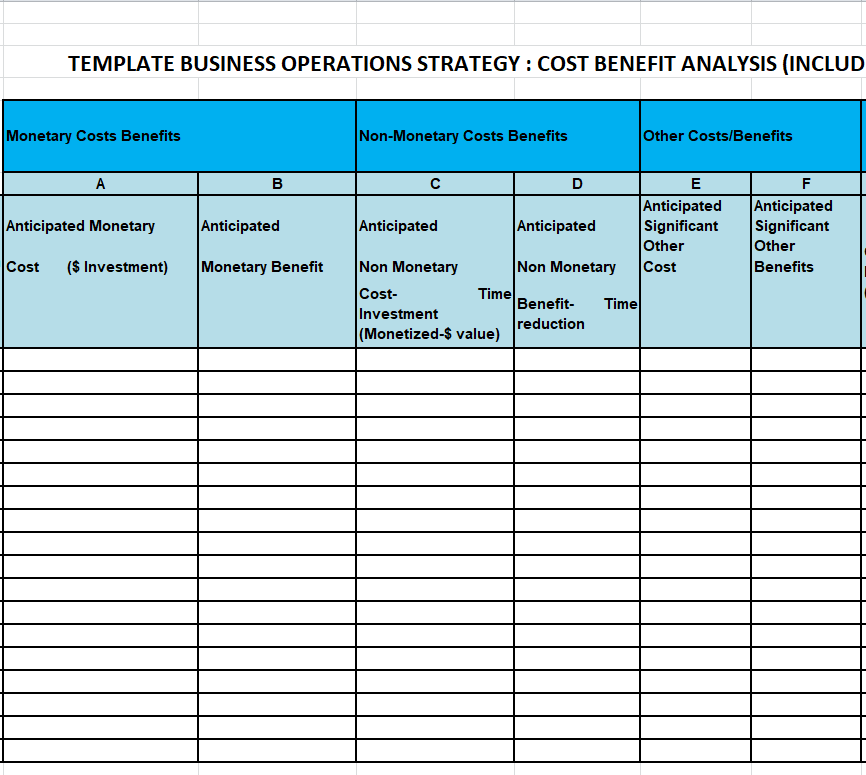
File Size: 09 KB
Long Term Project's Cost Benefit Analysis Template
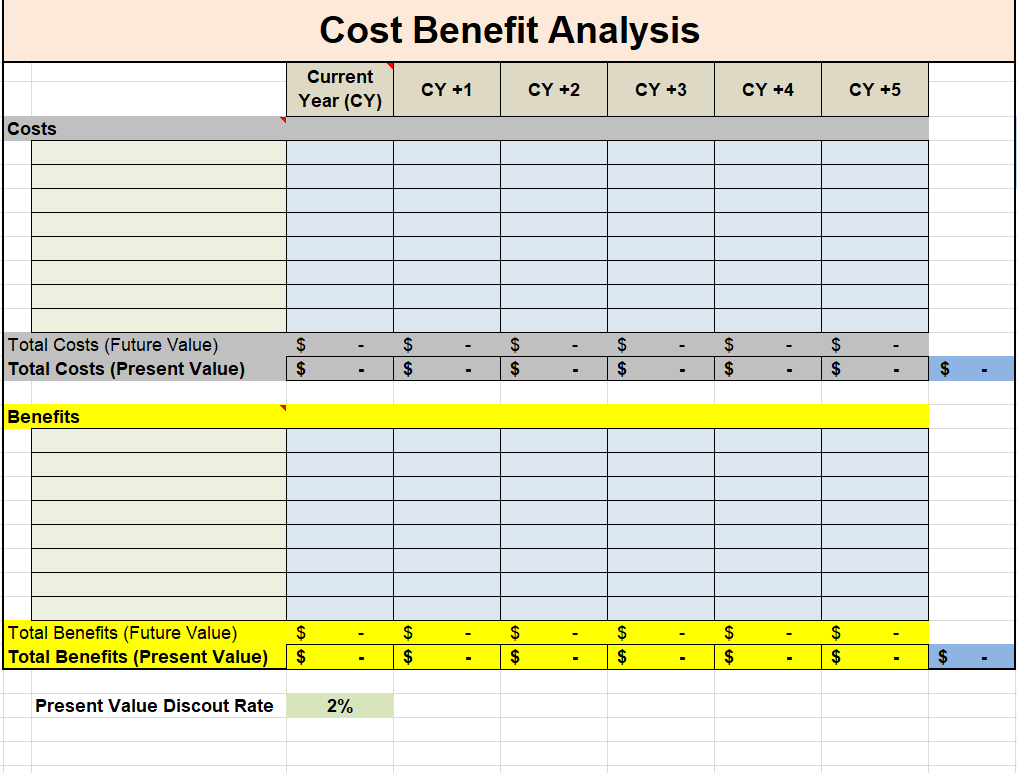
File Size: 10 KB
A final check before using the template
- Define the options, scope and period.
- Identify the currency and input sources.
- Separate one-time and recurring costs.
- Explain benefits and avoid double counting.
- Check timing, formulas and assumptions.
- Test the inputs that could change the decision.
Keep an evidence trail proportionate to the decision
For important inputs, record whether the amount came from a supplier quote, an internal record or an estimate and identify the relevant date. Note any conditions that would change it.
Keep supporting documents organized so a reviewer can check the basis without reopening the whole discussion. Do not burden a small comparison with unnecessary sheets, but avoid hiding material assumptions in an unlabeled note.
Before sharing, check the displayed totals against the underlying inputs and test an edit to a representative assumption. A saved number on a summary page is not evidence that all formulas and references still behave as intended.
Related templates
For a consistent baseline of actual sales results, start with sales report templates.
When comparing changes in stock handling, establish the quantities with stock inventory templates.
When an option includes an external maintenance service, review its scope separately using maintenance agreement templates.
For UK public-sector appraisal context, HM Treasury publishes the Green Book. Apply the appraisal approach appropriate to your own decision.
Frequently asked questions
Is a cost benefit analysis the same as a budget?
A budget organizes planned spending or resources. A cost benefit analysis compares costs with expected benefits for a stated decision. They may share inputs, but their purpose and the interpretation of the result differ.
Should staff time be treated as a cash saving?
Not automatically. Explain whether the change releases time, reduces paid expenditure or creates another benefit. Keep those effects distinct so the same improvement is not counted twice or presented as money available when it is not.
Can I use the example discount rate in a template?
Do not retain an unexplained assumption. Use the method and inputs appropriate to the decision and its required appraisal approach. Identify them clearly, and label a simple undiscounted example so it is not mistaken for a complete appraisal.
What if a benefit cannot be valued reliably?
Describe it separately and explain how it affects the decision. Avoid inventing a monetary amount merely to fill a cell. The comparison can show quantified results alongside important effects that need qualitative consideration.
What should a sensitivity check show?
It should reveal how meaningful changes in uncertain inputs affect the result. Focus on assumptions that could change the choice and explain their basis. Use the findings to identify where better evidence is needed before committing.
You can also browse more options in the Other Templates category.
